Example 1
Input year: 2016
Output ENSO classification: "El Nino"
Output ENSO strength: "very strong"
El Niño is a naturally occurring climate oscillation event in the equatorial Pacific which returns every 2–7 years. Originally, El Niño was the name used for warmer than average sea surface temperatures in the Pacific Ocean off the coast of South America but we now know that it's responsible for sea-surface temperature changes in the Pacific Ocean and global weather events. The ocean warming and associated wet climate off the coast of South America, which brings disastrous floods and reduces fishing stocks, is one of these events.
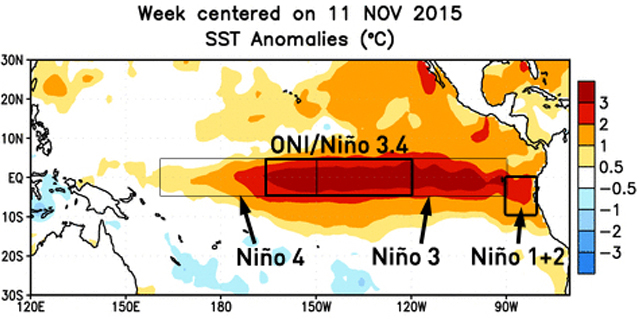
ENSO is the “El Niño-Southern Oscillation,” the name scientists use for El Niño. The other part of the climate oscillation, the Southern Oscillation, is a see-saw shift in surface air pressure between the eastern and western halves of the Pacific. When pressure rises in the east, it falls in the west and vice versa. In the 1950's scientists realized that El Niño and the Southern Oscillation were parts of the same event.
Warm water generally appears off the coast of South America close to Christmas, and reaches its peak warmth in fall of the following year. After peaking, the waters will tend to cool slowly through the winter and spring of the next year. The effects can be felt continually around the globe, for more than a year in some places.
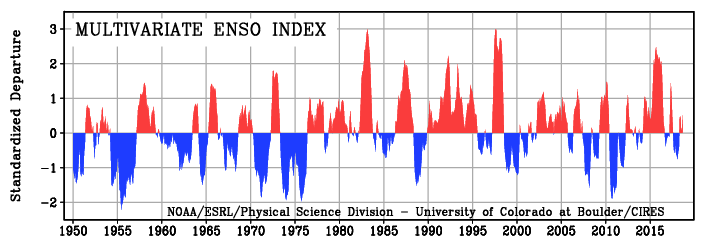
The Multivariate ENSO Index (MEI) is a method used to characterize the intensity of an ENSO event using a single number. It is more comprehensive than the Oceanic Niño Index (ONI) described above. The MEI accounts for sea level pressure, zonal and meridional components of the surface wind, sea surface temperature, surface air temperature and cloudiness.
The MEI is calculated for each “sliding bi-monthly period” (December-January, January-February, February-March, etc.) for a total of 12 per year. A warm El Niño event occurs when the MEI is at or above +0.5, and a cold La Niña event occurs when the MEI is at or below -0.5. The threshold is further broken down into weak (with a 0.5 to 1.0 anomaly), moderate (1.0 to 1.5), strong (1.5 to 2.0) and very strong (≥ 2.0) events.
Write a function that reads in this text file (mei_index.txt) containing the MEI index values from 1871 to 2016 and determines whether a specific year experienced an El Niño event or a La Niña event (and the strength of the event). The file is provided by NOAA (source).
To determine whether a particular year experienced an El Niño or a La Niña event, use the maximum absolute MEI value in that year. So if one year saw a maximum MEI value of +1.8 and a minimum MEI value of -1.2, then it would be a strong El Niño event.
Input: Year as an integer.
Output:
Two strings:
| Difficulty | Timesink | ||
|---|---|---|---|
| Function | enso_classification(year) | ||
You must be logged in to view your submissions.
Let us know what you think about this problem! Was it too hard? Difficult to understand? Also feel free to discuss the problem, ask questions, and post cool stuff on Discourse. You should be able see a discussion thread below. Would be nice if you don't post solutions in there but if you do then please organize and document your code well so others can learn from it.