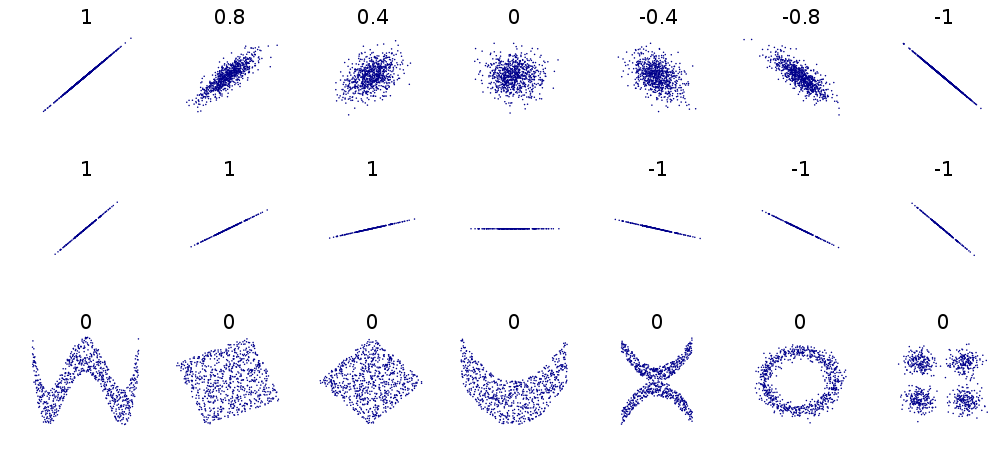
Example
Input xₙ: [ 5427, 5688, 6198, 6462, 6635, 7336, 7248, 7491, 8161, 8578, 9000]
Input yₙ: [18.079, 18.594, 19.753, 20.734, 20.831, 23.029, 23.597, 23.584, 22.525, 27.731, 29.449]
Output correlation coefficient: 0.94684375
Two variables are correlated if there's some statistical relationship between the two. However, just because two variables are correlated does not mean that one is caused by the other. This misconception is commonly referred to as “correlation does not imply causation”.

One way of computing a correlation coefficient between two variables $X$ and $Y$ with $n$ measurements $x_1, x_2, \dots, x_n$ and $y_1, y_2, \dots, y_n$ is the Pearson correlation coefficient $$ r = \frac{\operatorname{cov}(X,Y)}{\sigma_X\sigma_Y} $$ where $$ \operatorname{cov}(X,Y) = \frac{1}{n} \sum_{i=1}^n (x_i - \overline{x})(y_i - \overline{y}) = \frac{1}{n} \left[ (x_1-\overline{x})(y_1-\overline{y}) + \cdots + (x_n-\overline{x})(y_n-\overline{y}) \right] $$ is the covariance between $X$ and $Y$, \begin{align} \sigma_X & = \sqrt{\frac{1}{n} \sum_{i=1}^n (x_i - \overline{x})^2} = \sqrt{\frac{1}{n} \left[ (x_1 - \overline{x})^2 + \cdots + (x_n-\overline{x})^2 \right]} \quad \text{and} \\ \sigma_Y & = \sqrt{\frac{1}{n} \sum_{i=1}^n (y_i - \overline{y})^2} = \sqrt{\frac{1}{n} \left[ (y_1 - \overline{y})^2 + \cdots + (y_n-\overline{y})^2 \right]} \end{align} are the standard deviations of $X$ and $Y$, and $$ \overline{x} = \frac{1}{n} \sum_{i=1}^n x_i = \frac{x_1 + x_2 + \cdots + x_n}{n} \quad \text{and} \quad \overline{y} = \frac{1}{n} \sum_{i=1}^n y_i = \frac{y_1 + y_2 + \cdots + y_n}{n} $$ are the averages (or means) of the $X$ and $Y$ measurements. The Pearson correlation coefficient $r$ is always between -1 and 1.
Taking in two lists of measurements $x_n$ and $y_n$, return the Pearson correlation coefficient for them.
Input: Two lists $x_n$ and $y_n$ of size $n$.
Output: The Pearson correlation coefficient $r$ between the two variables.
| Difficulty | Timesink | ||
|---|---|---|---|
| Function | correlation_coefficient(x, y) | ||
You must be logged in to view your submissions.
Let us know what you think about this problem! Was it too hard? Difficult to understand? Also feel free to discuss the problem, ask questions, and post cool stuff on Discourse. You should be able see a discussion thread below. Would be nice if you don't post solutions in there but if you do then please organize and document your code well so others can learn from it.